
Research

advance the frontiers of knowledge and foster industry innovation.
Outreach

ensure that professionals are aware of and can access our research results
Education

bring research advances and state-of- the-art practices into the practitioner’s portfolio of skills
Industry Partnerships

conduct proprietary research for clients and develop innovative products with business partners, providing them with an edge over the competition
Latest research


News

25-04-2024
Rob Arnold discussed the imperative of enhancing infrastructure resilience at OECD...
Rob Arnold, Sustainability Research Director at EDHEC-Risk Climate Impact Institute, has been invited to take part in a panel discussion on "Reporting standards to address resilience for investors” at the OECD Infrastructure Forum: Infrastructure for Resilience, which took place on April 9 and 10 in Paris.
Other panelists included Christophe Dossarps, CEO, Source; Nancy Saich,...

03-04-2024
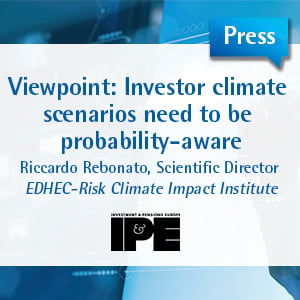
Spring 2024 EDHEC-Risk Climate special...
Our first Research Insights supplement for Investment & Pensions Europe (IPE) provides science-based answers to pressing investment questions in relation to climate...

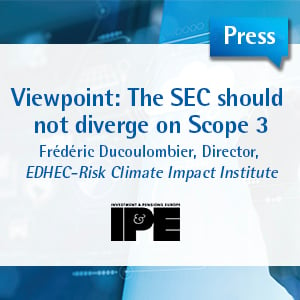
25-03-2024
March 2024 EDHEC-Risk Climate special...
Our first Research for Institutional Money Management supplement for Pensions & Investments (P&I) provides science-based answers to pressing investment questions in relation to...
About EDHEC
Operating from campuses in Lille, Nice, Paris, London and Singapore, EDHEC is one of the world’s top 15 business schools. Fully international and directly connected to the business world, EDHEC commands a strong reputation for research excellence and the ability to train entrepreneurs and managers capable of breaking new ground. EDHEC functions as a genuine laboratory of ideas and produces innovative solutions valued by businesses. The School’s teaching is inspired by its research work and a focus on “learning by doing”, all with the aim of equipping people with the skills to succeed in business.
